Choosing the right KPIs can feel overwhelming when you’re staring at dozens of metrics across multiple platforms. Which numbers actually matter? Which ones should you ignore? And most importantly—when should you use each one?
This guide cuts through the noise. You’ll get a prioritized list of the top KPIs for digital marketing, complete with formulas and specific scenarios for when to track each metric. Whether you’re launching a new campaign, optimizing an existing funnel, or reporting to stakeholders, you’ll know exactly which KPIs to focus on.
DashThis: Marketing Reports Made Simple
Automated and easy-to-use marketing reporting tool to save hours of work and create impactful reports.

Key Features
- Automated and customizable dashboards
- Integrations with 80+ platforms
- Pre-built templates for different reports
- White-label reports
- Automated sharing and scheduling
- AI Insights for smart analytics
* This is an affiliate link. If you make a purchase through this link, I may receive a commission at no extra cost to you.
Why KPIs Matter in Digital Marketing
Key Performance Indicators (KPIs) are your marketing compass. They tell you whether you’re moving toward your goals or drifting off course. Without them, you’re navigating blind.
Clear Objectives, Better Results
The best digital marketing KPIs connect directly to business outcomes. When your team knows that « we need to reduce cost per lead from $45 to $35, » everyone understands what success looks like. Vague goals like « increase engagement » don’t give your team a target to hit.
Data-Driven Decisions
With the right KPIs, you replace guesswork with evidence:
- Should you increase budget on Facebook or Google Ads? Check your ROAS by channel.
- Is your new landing page working? Compare conversion rates before and after.
- Are your SEO efforts paying off? Track organic traffic growth and organic conversion rate.
Every decision becomes faster and more confident when you’re looking at the key digital marketing KPIs that matter.
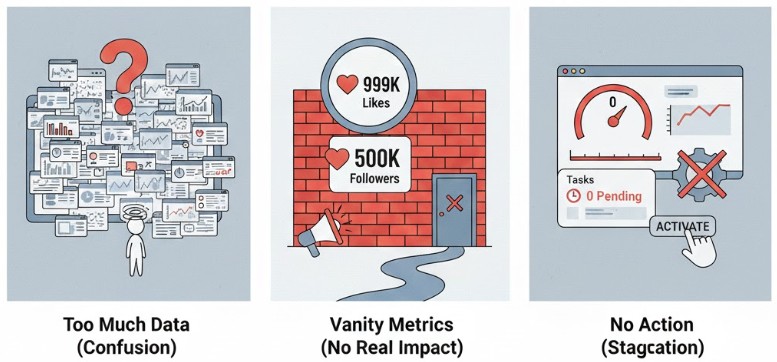
Common Mistakes That Cost Money
Most marketers make three critical errors:
Tracking too many metrics: When you monitor 30+ KPIs, none get the attention they deserve. Focus on 5-7 primary indicators.
Confusing vanity metrics with KPIs: Likes, followers, and page views feel good but rarely correlate with revenue. The most important KPIs in digital marketing tie directly to business outcomes.
Measuring without acting: KPIs exist to trigger action. If a metric doesn’t lead to a decision, stop tracking it.
Now let’s dive into the main KPIs for digital marketing and when to use each one.
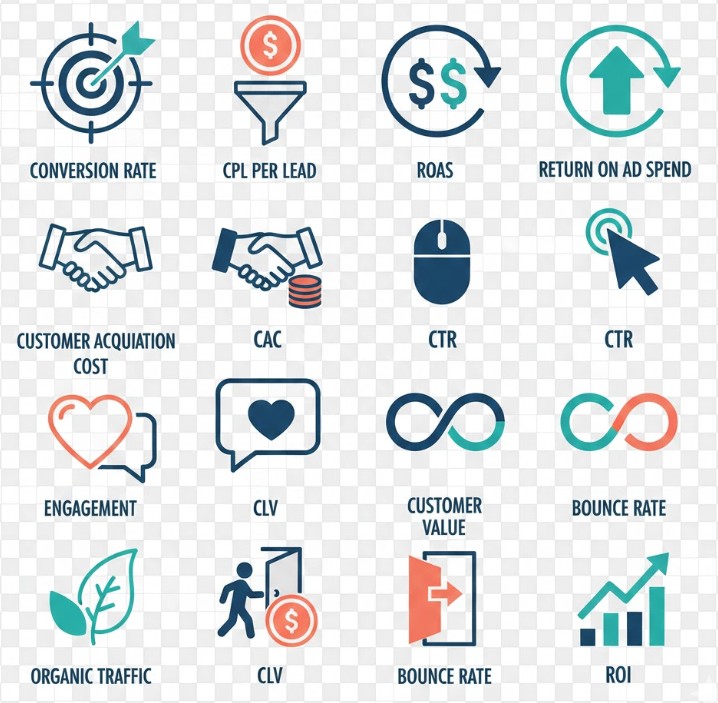
The 15 Most Important Digital Marketing KPIs
Here’s your curated list of best digital marketing KPIs, ranked by impact and versatility. Each includes the formula, calculation method, and specific use cases.
1. Conversion Rate
Definition: The percentage of visitors who complete your desired action (purchase, signup, download, etc.).
Formula: (Total Conversions ÷ Total Visitors) × 100
How to Calculate: If 5,000 people visit your landing page and 150 make a purchase, your conversion rate is (150 ÷ 5,000) × 100 = 3%.
When to Use It:
- Landing page optimization: Test headlines, CTAs, and layouts
- Funnel analysis: Identify where prospects drop off
- Campaign effectiveness: Compare performance across channels
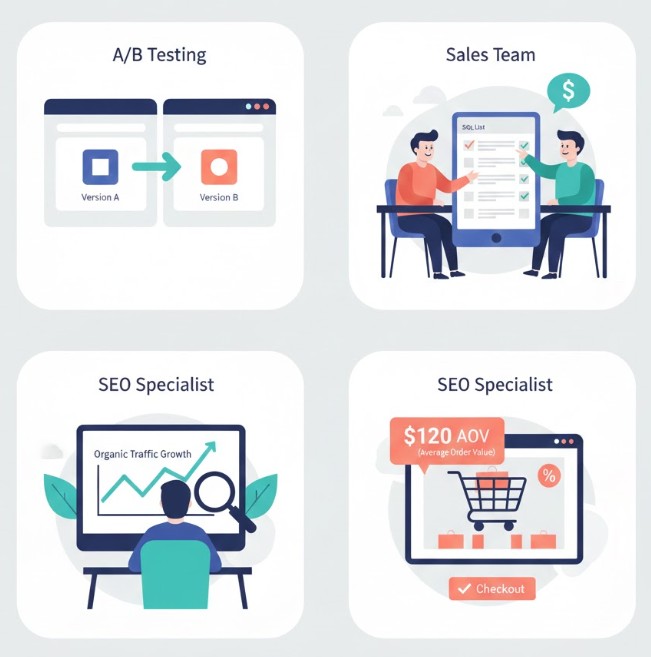
- A/B testing: Measure which variant drives more conversions
- E-commerce performance: Track product page or checkout effectiveness
Why It’s Essential: Conversion rate directly measures how well your marketing persuades people to act. A 1% improvement can double your revenue if traffic stays constant.
2. Cost Per Lead (CPL)
Definition: The average amount you spend to acquire one qualified lead.
Formula: Total Marketing Spend ÷ Total Leads Generated
How to Calculate: If you spend $8,000 on ads and generate 320 leads, your CPL is $8,000 ÷ 320 = $25 per lead.
When to Use It:
- Lead generation campaigns: Essential for B2B and service businesses
- Budget allocation: Identify which channels deliver the cheapest qualified leads
- Campaign profitability: Ensure CPL is significantly lower than customer lifetime value
- Sales team planning: Forecast lead volume based on budget
- Vendor comparison: Compare cost efficiency between platforms (Facebook vs. LinkedIn vs. Google)
Why It’s Essential: CPL tells you if your lead generation is economically sustainable. If your CPL exceeds customer value, you’re losing money with every new lead.
DashThis: Marketing Reports Made Simple
Automated and easy-to-use marketing reporting tool to save hours of work and create impactful reports.
Key Features
- Automated and customizable dashboards
- Integrations with 80+ platforms
- Pre-built templates for different reports
- White-label reports
- Automated sharing and scheduling
- AI Insights for smart analytics
* This is an affiliate link. If you make a purchase through this link, I may receive a commission at no extra cost to you.
3. ROAS (Return on Ad Spend)
Definition: The revenue generated for every dollar spent on advertising.
Formula: Revenue from Ads ÷ Ad Spend
How to Calculate: If you spend $10,000 on Google Ads and generate $65,000 in attributed revenue, your ROAS is $65,000 ÷ $10,000 = 6.5 (or 6.5:1, often expressed as 650%).
When to Use It:
- Paid advertising performance: Your primary profitability metric for paid channels
- Budget scaling decisions: High ROAS campaigns deserve more investment
- Platform comparison: Determine which ad platforms deliver the best return
- Campaign optimization: Identify winning ad sets, audiences, and creatives
- E-commerce profitability: Essential for any business selling products online
Why It’s Essential: ROAS directly answers the question: « Are my ads making money? » It’s the most important KPI for any paid marketing strategy.
4. Customer Acquisition Cost (CAC)
Definition: The total cost to acquire one new customer, including all marketing and sales expenses.
Formula: (Total Marketing Spend + Total Sales Costs) ÷ New Customers Acquired
How to Calculate: If you spend $30,000 on marketing and $15,000 on sales costs, and acquire 150 new customers, your CAC is $45,000 ÷ 150 = $300 per customer.
When to Use It:
- Business model validation: Ensure CAC is less than customer lifetime value (ideally 3:1 ratio)
- Growth sustainability: Low CAC enables faster, more profitable scaling
- Investor reporting: Critical metric for fundraising and business valuation
- Channel strategy: Compare full-funnel acquisition costs across channels
- Team efficiency: Track improvements as marketing and sales processes mature
Why It’s Essential: CAC determines whether your business model is viable. If it costs $500 to acquire a customer who generates $400 in lifetime value, you’re going bankrupt with every sale.
5. Click-Through Rate (CTR)
Definition: The percentage of people who click your ad or link after seeing it.
Formula: (Total Clicks ÷ Total Impressions) × 100
How to Calculate: If your ad receives 1,250 clicks from 62,500 impressions, your CTR is (1,250 ÷ 62,500) × 100 = 2%.
When to Use It:
- Ad relevance testing: Higher CTR indicates better message-market fit
- Quality Score improvement: Google rewards high CTR with lower costs and better ad positions
- Email subject line testing: Measure which subjects drive opens (for email, this becomes « open rate »)
- SEO title optimization: Test title tags to improve organic CTR
- Creative performance: Identify which ad copy, images, or videos resonate most
Why It’s Essential: CTR is your first indicator of marketing resonance. If people won’t even click, they’ll never convert. It’s also the gateway metric—without clicks, nothing else happens.
6. Engagement Rate
Definition: The percentage of your audience that actively interacts with your content through likes, comments, shares, saves, or other meaningful actions.
Formula: (Total Engagements ÷ Total Reach or Followers) × 100
How to Calculate: If your Instagram post gets 750 total engagements (likes + comments + shares + saves) and reaches 15,000 people, your engagement rate is (750 ÷ 15,000) × 100 = 5%.
When to Use It:
- Social media performance: The most important social media KPI beyond vanity metrics
- Content quality assessment: High engagement signals valuable, resonant content
- Algorithm optimization: Platforms reward engaging content with greater reach
- Influencer evaluation: Separate real influence from purchased followers
- Community health: Track how actively your audience participates
Why It’s Essential: Engagement rate reveals whether your content actually matters to your audience. You can have 100,000 followers, but if only 50 people engage, your influence is minimal.
7. Customer Lifetime Value (CLV)
Definition: The total revenue you expect from a customer throughout their entire relationship with your business.
Formula: (Average Purchase Value × Purchase Frequency) × Average Customer Lifespan
How to Calculate: If customers spend $200 per purchase, buy 4 times per year, and remain customers for 3 years on average, CLV = ($200 × 4) × 3 = $2,400.
When to Use It:
- Acquisition budget setting: You can afford higher CAC when CLV is high
- Retention strategy: Focus on increasing CLV through upsells, cross-sells, and loyalty
- Customer segmentation: Identify your most valuable customer profiles
- Business valuation: Higher CLV dramatically increases company value
- Pricing decisions: Understand long-term value when setting prices
Why It’s Essential: CLV determines how aggressively you can grow. Companies with high CLV can outspend competitors on acquisition and still win.
DashThis: Marketing Reports Made Simple
Automated and easy-to-use marketing reporting tool to save hours of work and create impactful reports.
Key Features
- Automated and customizable dashboards
- Integrations with 80+ platforms
- Pre-built templates for different reports
- White-label reports
- Automated sharing and scheduling
- AI Insights for smart analytics
* This is an affiliate link. If you make a purchase through this link, I may receive a commission at no extra cost to you.
8. Bounce Rate
Definition: The percentage of visitors who leave your site after viewing only one page without any interaction.
Formula: (Single-Page Sessions ÷ Total Sessions) × 100
How to Calculate: If you have 4,200 single-page sessions out of 12,000 total sessions, your bounce rate is (4,200 ÷ 12,000) × 100 = 35%.
When to Use It:
- Landing page effectiveness: High bounce rates signal poor message match or user experience
- Content quality diagnosis: Identify pages that fail to engage visitors
- Technical issue detection: Sudden bounce rate spikes may indicate broken pages or slow load times
- Traffic quality assessment: High bounce rates from certain sources suggest poor targeting
- Mobile optimization: Compare mobile vs. desktop bounce rates to find UX problems
Why It’s Essential: Bounce rate is your early warning system. When visitors immediately leave, something is wrong—whether it’s targeting, messaging, design, or technical performance.
9. Organic Traffic Growth
Definition: The month-over-month or year-over-year percentage increase in visitors arriving from unpaid search results.
Formula: ((Current Period Traffic − Previous Period Traffic) ÷ Previous Period Traffic) × 100
How to Calculate: If you had 18,000 organic visitors last month and 22,500 this month, your growth is ((22,500 − 18,000) ÷ 18,000) × 100 = 25% MoM growth.
When to Use It:
- SEO strategy validation: Confirms your content and optimization efforts are working
- Long-term marketing health: Organic traffic compounds over time with less ongoing cost
- Content marketing ROI: Measures the effectiveness of your content investments
- Reduced dependency on paid ads: Growing organic traffic lowers customer acquisition costs
- Competitive positioning: Track visibility gains or losses vs. competitors
Why It’s Essential: Organic traffic is your most valuable traffic source over time. It costs nothing per click once you’ve earned rankings, and it indicates genuine market authority.
10. Sales-Qualified Leads (SQLs)
Definition: Leads that have been vetted by marketing and meet specific criteria making them ready for direct sales outreach.
Formula: Count of leads meeting SQL criteria (typically scored based on behavior, demographics, and engagement)
How to Calculate: If your criteria require leads to have downloaded 2+ resources, visited pricing page, work at target company size, and have decision-making authority, you count how many leads meet all conditions. Example: 127 SQLs this month.
When to Use It:
- B2B lead generation: Critical metric for companies with sales teams
- Marketing-sales alignment: Creates common language and handoff standards
- Lead quality improvement: Focus marketing on attracting and nurturing the right prospects
- Sales team efficiency: Sales can focus only on the most promising opportunities
- Campaign optimization: Identify which campaigns generate the highest SQL percentage
Why It’s Essential: SQLs bridge the gap between marketing activity and revenue. Total leads don’t matter if none of them buy—SQLs focus everyone on quality over quantity.
11. Email Open Rate
Definition: The percentage of delivered emails that recipients opened.
Formula: (Emails Opened ÷ Emails Delivered) × 100
How to Calculate: If you send 25,000 emails, 24,500 are delivered, and 5,145 are opened, your open rate is (5,145 ÷ 24,500) × 100 = 21%.
When to Use It:
- Subject line optimization: Test which approaches drive more opens
- Send time testing: Identify when your audience is most responsive
- List health monitoring: Declining open rates signal list fatigue or poor targeting
- Segmentation effectiveness: Compare open rates across different audience segments
- Re-engagement campaigns: Identify inactive subscribers needing special attention
Why It’s Essential: If subscribers don’t open your emails, nothing else in your email marketing matters. Open rate is the gateway to all other email metrics.
12. Cost Per Click (CPC)
Definition: The average amount you pay each time someone clicks your ad.
Formula: Total Ad Spend ÷ Total Clicks
How to Calculate: If you spend $3,500 and receive 1,400 clicks, your CPC is $3,500 ÷ 1,400 = $2.50.
When to Use It:
- Budget forecasting: Predict how many clicks you’ll get for your budget
- Bid strategy optimization: Adjust bids to get maximum clicks within budget
- Keyword selection: Identify high-value, low-cost keywords
- Ad quality improvement: Better ads lower your CPC through higher Quality Scores
- Platform comparison: Compare cost efficiency (Google vs. Facebook vs. LinkedIn)
Why It’s Essential: CPC directly impacts your profitability. Lower CPC means you can generate more traffic and conversions with the same budget.
DashThis: Marketing Reports Made Simple
Automated and easy-to-use marketing reporting tool to save hours of work and create impactful reports.
Key Features
- Automated and customizable dashboards
- Integrations with 80+ platforms
- Pre-built templates for different reports
- White-label reports
- Automated sharing and scheduling
- AI Insights for smart analytics
* This is an affiliate link. If you make a purchase through this link, I may receive a commission at no extra cost to you.
13. Average Order Value (AOV)
Definition: The average amount spent each time a customer completes a purchase.
Formula: Total Revenue ÷ Total Number of Orders
How to Calculate: If you generate $125,000 in revenue from 850 orders, your AOV is $125,000 ÷ 850 = $147.06.
When to Use It:
- E-commerce optimization: Focus on strategies to increase basket size
- Upsell/cross-sell testing: Measure effectiveness of product recommendations
- Pricing strategy: Understand customer spending patterns
- Promotion planning: Calculate how discounts impact overall order value
- Customer segmentation: Identify high-value vs. low-value customer groups
Why It’s Essential: Increasing AOV is often easier than acquiring new customers. A 15% AOV increase can have the same revenue impact as a 15% increase in traffic.
14. Lead-to-Customer Conversion Rate
Definition: The percentage of leads that eventually become paying customers.
Formula: (New Customers ÷ Total Leads) × 100
How to Calculate: If you generate 800 leads and 120 become customers, your lead-to-customer rate is (120 ÷ 800) × 100 = 15%.
When to Use It:
- Full-funnel optimization: Understand what happens after lead capture
- Sales process improvement: Identify bottlenecks in sales follow-up
- Lead quality assessment: High volume, low conversion suggests targeting problems
- Revenue forecasting: Predict customers based on lead pipeline
- Marketing-sales accountability: Shared responsibility for the complete funnel
Why It’s Essential: This metric reveals whether you’re generating the right kinds of leads. You can have a massive lead list, but if none convert to customers, your marketing isn’t working.
15. Return on Investment (ROI)
Definition: The overall profitability of your marketing efforts, measuring net profit relative to costs.
Formula: ((Revenue from Marketing − Marketing Costs) ÷ Marketing Costs) × 100
How to Calculate: If you spend $50,000 on marketing and generate $200,000 in attributed revenue, your ROI is (($200,000 − $50,000) ÷ $50,000) × 100 = 300%.
When to Use It:
- Budget justification: Prove marketing’s contribution to business growth
- Strategic planning: Determine which initiatives deserve continued investment
- Executive reporting: The universal language of business leadership
- Cross-channel comparison: Compare ROI across all marketing activities
- Long-term performance: Measure marketing effectiveness over quarters or years
Why It’s Essential: ROI is the ultimate scorecard. It answers the only question executives really care about: « Are we making more money than we’re spending? »
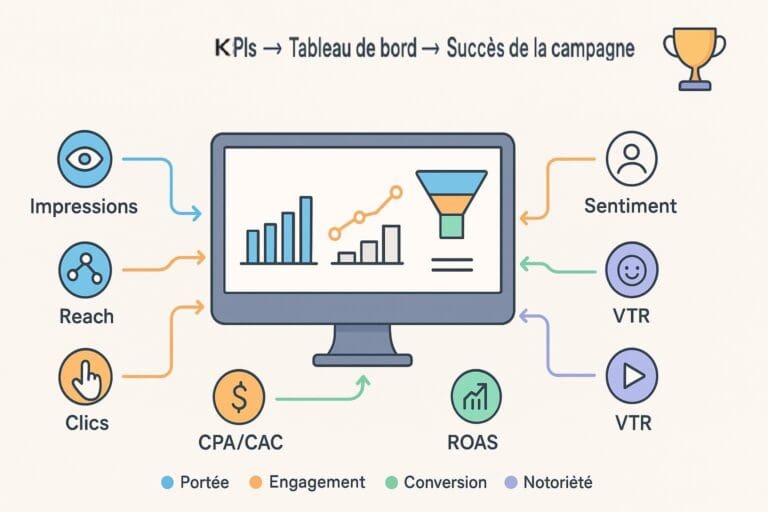
KPI Selection Matrix: Which KPIs for Which Goal?
Different business objectives require different most important digital marketing KPIs. Use this matrix to quickly identify which metrics matter most for your current goals.
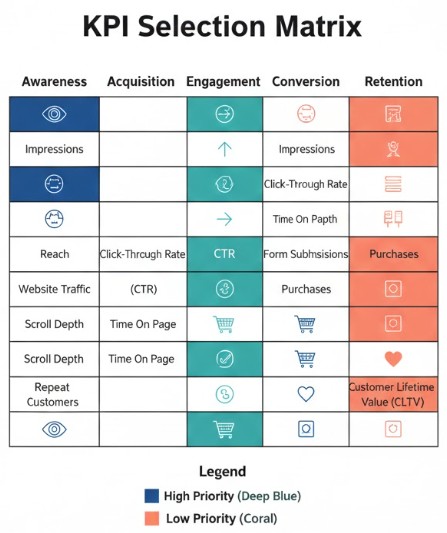
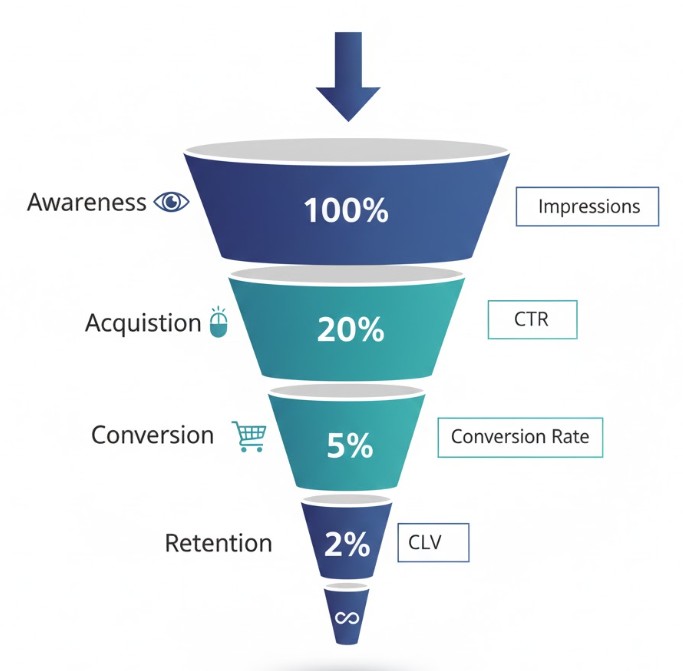
Awareness Stage Goals
Objective: Increase brand visibility and reach new audiences
Primary KPIs:
- Impressions
- Reach
- Brand search volume
- Website traffic
- Social media followers (with engagement rate)
Use When: Launching new brands, entering new markets, building top-of-funnel presence
Acquisition Stage Goals
Objective: Drive qualified traffic and capture leads
Primary KPIs:
- Click-through rate (CTR)
- Cost per click (CPC)
- Cost per lead (CPL)
- Landing page conversion rate
- Traffic by channel
Use When: Running lead generation campaigns, optimizing ad performance, testing new channels
Engagement Stage Goals
Objective: Nurture prospects and build relationships
Primary KPIs:
- Engagement rate
- Time on page
- Pages per session
- Email open rate
- Email click-through rate
- Content downloads
Use When: Building authority, educating prospects, nurturing leads through longer sales cycles
Conversion Stage Goals
Objective: Turn prospects into paying customers
Primary KPIs:
- Conversion rate
- ROAS (Return on Ad Spend)
- Cost per acquisition (CAC)
- Lead-to-customer conversion rate
- Sales-qualified leads (SQLs)
- Average order value (AOV)
Use When: Optimizing checkout flows, improving sales processes, scaling profitable campaigns
Retention Stage Goals
Objective: Keep customers and increase lifetime value
Primary KPIs:
- Customer lifetime value (CLV)
- Repeat purchase rate
- Customer retention rate
- Churn rate
- Net Promoter Score (NPS)
Use When: Focusing on existing customer growth, reducing acquisition dependency, building sustainable business models
Quick Selection Guide by Business Type
E-commerce: ROAS, conversion rate, AOV, CLV, cart abandonment rate
B2B/Lead Gen: CPL, SQL count, lead-to-customer rate, CAC, sales cycle length
SaaS: Free trial conversion rate, CAC, CLV, churn rate, monthly recurring revenue
Content/Media: Engagement rate, time on site, pages per session, ad RPM, subscriber growth
Local Business: Store visits (from ads), call tracking, local search rankings, review rating/volume
Mistakes to Avoid
Even with the right KPIs, execution mistakes can undermine your entire measurement strategy.
Tracking Too Many KPIs
The Problem: Dashboards with 30+ metrics create analysis paralysis. No one knows what to focus on, so nothing improves.
The Solution: Limit yourself to 5-7 primary KPIs per channel or campaign. Everything else is supporting data, not a KPI.
Example: For a paid ads campaign, focus on ROAS, CTR, CPC, conversion rate, and CAC. The other 20 metrics are interesting but not actionable.
Chasing Vanity Metrics
The Problem: Metrics that look impressive but don’t correlate with business outcomes waste time and resources.
The Solution: Every KPI should pass this test: « If this number improves, does revenue or profit increase? »
Common Vanity Metrics to Avoid:
- Social media followers (without engagement or traffic)
- Page views (without conversion context)
- Email list size (without engagement or revenue)
- App downloads (without usage or retention)
Better Alternatives: Engagement rate, revenue per subscriber, active users, customer retention rate
Ignoring Attribution Complexity
The Problem: Last-click attribution gives all credit to the final touchpoint, completely misrepresenting your marketing effectiveness.
The Solution: Use multi-touch attribution models when possible, or at minimum acknowledge that your « conversion source » data oversimplifies reality.
Example: A customer discovers you through organic search, reads three blog posts, signs up for your email list, receives five nurture emails, clicks a retargeting ad, and finally converts. Giving all credit to that retargeting ad undervalues your SEO and email marketing.
Not Segmenting Your KPIs
The Problem: Aggregate data hides critical insights. Your average performance might be fine while specific segments are either struggling or excelling.
The Solution: Always segment key digital marketing KPIs by:
- Channel (organic vs. paid vs. social vs. email)
- Device (mobile vs. desktop)
- Audience type (new vs. returning, demographic segments)
- Campaign type (brand vs. non-brand, remarketing vs. cold traffic)
Example: Your overall conversion rate is 3%, but mobile is 1.2% while desktop is 4.8%. That’s a mobile experience problem you can fix.
Setting KPIs Without Targets
The Problem: Tracking metrics without goals makes it impossible to know if you’re succeeding.
The Solution: Every KPI needs a target based on:
- Historical performance (improve 15% from last quarter)
- Industry benchmarks (achieve top quartile performance)
- Business requirements (hit $50,000 in monthly revenue)
Example: Instead of « track ROAS, » set « achieve 6:1 ROAS by end of Q2, up from current 4.2:1. »
DashThis: Marketing Reports Made Simple
Automated and easy-to-use marketing reporting tool to save hours of work and create impactful reports.
Key Features
- Automated and customizable dashboards
- Integrations with 80+ platforms
- Pre-built templates for different reports
- White-label reports
- Automated sharing and scheduling
- AI Insights for smart analytics
* This is an affiliate link. If you make a purchase through this link, I may receive a commission at no extra cost to you.
Track Less, Achieve More
The best digital marketing KPIs aren’t the ones that generate the most data—they’re the ones that drive the clearest actions.
Start with 5-7 core metrics aligned to your current business priority. Master those before adding more. Remember: improving a small number of key metrics dramatically beats tracking dozens of metrics and improving none.
Your Next Steps:
- Identify your primary business goal (awareness, acquisition, conversion, or retention)
- Choose 5-7 KPIs from this list that directly support that goal
- Set specific targets for each KPI based on your current performance
- Build a simple dashboard to track these metrics daily or weekly
- Review and act on your KPIs regularly—data without action is worthless
Need help building a comprehensive KPI tracking system? Check out our complete guide to digital marketing KPIs and metrics with templates, dashboards, and step-by-step implementation guides.

Free Resources:
- Digital Marketing KPI Template (Google Sheets)
- KPI Dashboard Builder (Looker Studio)
- KPI Selection Worksheet (PDF)
Track what matters. Ignore the rest. Grow faster.