In today’s data-driven marketing landscape, success isn’t measured by gut feelings or assumptions—it’s measured by numbers. Whether you’re running paid campaigns, optimizing SEO strategies, or managing social media accounts, understanding which digital marketing KPIs and metrics to track can mean the difference between campaigns that convert and budgets that burn.
This comprehensive guide breaks down everything you need to know about key performance indicators digital marketing teams rely on. You’ll discover the most important digital marketing KPIs, learn how to choose the right metrics for your business, and get access to ready-to-use templates and dashboards.
Let’s turn your marketing data into actionable insights.
DashThis: Marketing Reports Made Simple
Automated and easy-to-use marketing reporting tool to save hours of work and create impactful reports.

Key Features
- Automated and customizable dashboards
- Integrations with 80+ platforms
- Pre-built templates for different reports
- White-label reports
- Automated sharing and scheduling
- AI Insights for smart analytics
* This is an affiliate link. If you make a purchase through this link, I may receive a commission at no extra cost to you.
What Are Digital Marketing KPIs?
Key Performance Indicators (KPIs) are quantifiable measurements that help you evaluate the success of your marketing activities against specific business objectives. Think of them as your marketing report card—they tell you what’s working, what’s not, and where to focus your efforts.
The Difference Between KPIs and Metrics
Here’s where many marketers get confused: all KPIs are metrics, but not all metrics are KPIs.
- Metrics are any data points you can measure (page views, likes, impressions, clicks)
- KPIs are the specific metrics that directly tie to your business goals and indicate performance
For example, if your goal is to generate qualified leads, your KPI might be « cost per lead » rather than just « website traffic. » Traffic is a metric; cost per lead tied to your budget and revenue goals is a KPI.
Why Digital Marketing KPIs Matter
Without clear KPIs, you’re flying blind. Here’s what proper KPI tracking gives you:
Strategic clarity: You know exactly what success looks like for each campaign and channel.
Resource optimization: You can allocate budget to the channels and tactics delivering the best ROI.
Performance accountability: Teams understand what they’re responsible for and can measure their impact.
Data-driven decisions: You replace guesswork with evidence-based strategy adjustments.
Stakeholder communication: You can demonstrate marketing’s contribution to business outcomes with concrete numbers.
How KPIs Connect to Business Goals
Effective digital marketing KPI examples always start with business objectives, not vanity metrics. Here’s the connection:
- Business Goal: Increase revenue by 30%
- Marketing Goal: Generate 500 qualified leads per month
- KPI: Cost per qualified lead, lead-to-customer conversion rate, customer acquisition cost
This alignment ensures your marketing activities directly contribute to what matters most: business growth.
Common Mistakes When Choosing KPIs
Before we dive deeper, avoid these pitfalls:
- Tracking too many KPIs (stick to 5-7 per channel)
- Choosing metrics that don’t connect to revenue or business impact
- Focusing only on vanity metrics (likes, followers without engagement)
- Not considering your customer journey and funnel stage
- Setting KPIs without benchmarks or targets
DashThis: Marketing Reports Made Simple
Automated and easy-to-use marketing reporting tool to save hours of work and create impactful reports.
Key Features
- Automated and customizable dashboards
- Integrations with 80+ platforms
- Pre-built templates for different reports
- White-label reports
- Automated sharing and scheduling
- AI Insights for smart analytics
* This is an affiliate link. If you make a purchase through this link, I may receive a commission at no extra cost to you.
How to Choose the Right Digital Marketing KPIs
Selecting the right digital marketing metrics and KPIs isn’t about tracking everything—it’s about tracking what matters for your specific business model, goals, and growth stage.
Framework: SMART Goals
Your KPIs should follow the SMART framework:
Specific: « Increase qualified leads » not « get more traffic »
Measurable: Define the exact metric and how you’ll track it
Achievable: Set realistic targets based on historical data and resources
Relevant: Connect directly to business objectives
Time-bound: Establish clear timeframes for evaluation
Example: « Increase email-generated revenue by 25% quarter-over-quarter by improving segmentation and personalization » is a SMART KPI.
Funnel-Based Approach
Different stages of your marketing funnel require different types of KPI in digital marketing:
Awareness Stage
- Focus: Reach and visibility
- Key question: Are people discovering our brand?
- Example KPIs: Impressions, reach, branded search volume, website traffic
Consideration Stage
- Focus: Engagement and interest
- Key question: Are prospects engaging with our content?
- Example KPIs: Engagement rate, time on page, content downloads, email signups
Conversion Stage
- Focus: Actions and revenue
- Key question: Are prospects becoming customers?
- Example KPIs: Conversion rate, cost per acquisition, ROAS, revenue per visitor
Retention Stage
- Focus: Loyalty and growth
- Key question: Are customers staying and buying more?
- Example KPIs: Customer lifetime value, repeat purchase rate, churn rate
KPIs vs. Vanity Metrics
Vanity metrics make you feel good but don’t drive business decisions:
| Vanity Metric | Why It’s Misleading | Better KPI Alternative |
|---|---|---|
| Page views | Doesn’t show engagement or value | Time on page + conversion rate |
| Social media followers | Doesn’t indicate engagement or sales | Engagement rate + traffic from social |
| Email list size | Doesn’t measure actual engagement | Open rate + click-through rate + revenue per subscriber |
| App downloads | Doesn’t show usage or retention | Daily active users + retention rate |
B2B vs. B2C Differences
Your business model significantly impacts which KPIs matter most:
B2B Focus:
- Lead quality over quantity (MQL, SQL metrics)
- Longer sales cycles (lead nurture engagement)
- Higher customer value (CLV, customer acquisition cost ratio)
- Account-based metrics (target account engagement)
B2C Focus:
- Transaction volume (conversion rate, average order value)
- Shorter sales cycles (immediate conversion metrics)
- Repeat purchase behavior (purchase frequency)
- Customer acquisition efficiency (CAC, ROAS)
Lead Gen vs. E-commerce KPIs
Lead Generation Businesses should prioritize:
- Cost per lead (CPL)
- Lead-to-customer conversion rate
- Sales-qualified lead (SQL) percentage
- Marketing qualified lead (MQL) to SQL ratio
- Sales cycle length
E-commerce Businesses should prioritize:
- Return on ad spend (ROAS)
- Average order value (AOV)
- Cart abandonment rate
- Customer lifetime value (CLV)
- Revenue per visitor
DashThis: Marketing Reports Made Simple
Automated and easy-to-use marketing reporting tool to save hours of work and create impactful reports.
Key Features
- Automated and customizable dashboards
- Integrations with 80+ platforms
- Pre-built templates for different reports
- White-label reports
- Automated sharing and scheduling
- AI Insights for smart analytics
* This is an affiliate link. If you make a purchase through this link, I may receive a commission at no extra cost to you.
The 25 Most Important Digital Marketing KPIs (With Formulas)
Here’s your definitive digital marketing KPI list, organized by funnel stage with formulas and practical examples.
>> Awareness KPIs
These top KPIs for digital marketing help you understand how many people are discovering your brand.
1. Impressions
The total number of times your content is displayed, regardless of clicks.
- Formula: Total ad/content displays
- Example: Your Facebook ad was shown 50,000 times = 50,000 impressions
- Why it matters: Measures potential reach and brand visibility
2. Reach
The number of unique users who saw your content.
- Formula: Unique users exposed to content
- Example: Your Instagram post reached 12,000 unique users
- Why it matters: Shows actual audience size vs. duplicate views
3. CPM (Cost Per Mille)
The cost to reach 1,000 impressions.
- Formula: (Total Ad Spend ÷ Total Impressions) × 1,000
- Example: $500 spend ÷ 250,000 impressions × 1,000 = $2 CPM
- Why it matters: Helps compare cost-efficiency across awareness campaigns
4. Website Traffic
Total visitors to your website within a specific timeframe.
- Formula: Total sessions or users (from analytics)
- Example: 45,000 monthly website visitors
- Why it matters: Fundamental metric for measuring digital presence and content performance
5. Brand Search Volume
Number of searches for your brand name or branded keywords.
- Formula: Monthly search volume for branded terms
- Example: « Your Company Name » searched 2,300 times/month
- Why it matters: Indicates brand awareness growth and marketing effectiveness
>> Acquisition KPIs
These digital marketing campaign KPIs measure how effectively you’re attracting potential customers.
6. Click-Through Rate (CTR)
Percentage of people who click after seeing your content.
- Formula: (Clicks ÷ Impressions) × 100
- Example: 1,200 clicks ÷ 60,000 impressions × 100 = 2% CTR
- Why it matters: Measures ad/content relevance and appeal
7. Cost Per Click (CPC)
Average amount you pay for each click.
- Formula: Total Ad Spend ÷ Total Clicks
- Example: $1,500 ÷ 750 clicks = $2 CPC
- Why it matters: Helps optimize budget allocation and bid strategies
8. Cost Per Lead (CPL)
Average cost to acquire one lead.
- Formula: Total Marketing Spend ÷ Total Leads Generated
- Example: $5,000 ÷ 200 leads = $25 CPL
- Why it matters: Critical for understanding lead generation efficiency and ROI
9. Landing Page Conversion Rate
Percentage of landing page visitors who complete desired action.
- Formula: (Conversions ÷ Landing Page Visitors) × 100
- Example: 85 form submissions ÷ 2,000 visitors × 100 = 4.25%
- Why it matters: Identifies page effectiveness and optimization opportunities
10. Bounce Rate
Percentage of visitors who leave without interacting.
- Formula: (Single-Page Sessions ÷ Total Sessions) × 100
- Example: 3,500 single-page sessions ÷ 10,000 total sessions × 100 = 35%
- Why it matters: High bounce rates may indicate poor content relevance or user experience issues
>> Engagement KPIs
These examples of KPIs in digital marketing show how audiences interact with your content.
11. Engagement Rate (Social)
Percentage of your audience that interacts with content.
- Formula: (Total Engagements ÷ Total Followers or Reach) × 100
- Example: 850 engagements ÷ 25,000 followers × 100 = 3.4%
- Why it matters: More valuable than follower count; shows active audience interest
12. Time on Page
Average duration visitors spend on a specific page.
- Formula: Total time on page ÷ Number of page views
- Example: 12,000 seconds ÷ 300 views = 40 seconds average
- Why it matters: Indicates content quality and user engagement depth
13. Pages Per Session
Average number of pages viewed during a single visit.
- Formula: Total Page Views ÷ Total Sessions
- Example: 28,000 page views ÷ 10,000 sessions = 2.8 pages/session
- Why it matters: Higher numbers suggest engaged visitors exploring your content
14. Email Open Rate
Percentage of recipients who opened your email.
- Formula: (Emails Opened ÷ Emails Delivered) × 100
- Example: 2,400 opens ÷ 10,000 delivered × 100 = 24%
- Why it matters: Measures subject line effectiveness and audience interest
15. Email Click-Through Rate
Percentage of email recipients who clicked a link.
- Formula: (Email Clicks ÷ Emails Delivered) × 100
- Example: 360 clicks ÷ 10,000 delivered × 100 = 3.6%
- Why it matters: Shows content relevance and call-to-action effectiveness
>> Conversion KPIs
These are among the most important digital marketing KPIs because they directly tie to revenue.
16. Conversion Rate
Percentage of visitors who complete a desired action.
- Formula: (Conversions ÷ Total Visitors) × 100
- Example: 150 purchases ÷ 5,000 visitors × 100 = 3%
- Why it matters: Core metric for measuring campaign effectiveness and revenue generation
17. Cost Per Conversion (CPA)
Average cost to generate one conversion.
- Formula: Total Marketing Spend ÷ Total Conversions
- Example: $8,000 ÷ 160 conversions = $50 CPA
- Why it matters: Essential for ROI calculation and budget planning
18. ROAS (Return on Ad Spend)
Revenue generated for every dollar spent on advertising.
- Formula: Revenue from Ads ÷ Ad Spend
- Example: $40,000 revenue ÷ $8,000 ad spend = 5:1 ROAS (or 500%)
- Why it matters: Direct measure of advertising profitability
19. Revenue Per Visitor
Average revenue generated from each website visitor.
- Formula: Total Revenue ÷ Total Website Visitors
- Example: $75,000 ÷ 25,000 visitors = $3 per visitor
- Why it matters: Helps assess overall site monetization effectiveness
20. Sales-Qualified Leads (SQL)
Number of leads vetted and ready for sales team outreach.
- Formula: Count of leads meeting qualification criteria
- Example: 85 SQLs generated this month
- Why it matters: Bridges marketing and sales; focuses on quality over quantity
>> Retention & Growth KPIs
These digital marketing KPI examples help you understand long-term customer value.
21. Customer Lifetime Value (CLV)
Total revenue expected from a customer throughout their relationship.
- Formula: (Average Purchase Value × Purchase Frequency) × Average Customer Lifespan
- Example: ($150 × 4 purchases/year) × 3 years = $1,800 CLV
- Why it matters: Determines how much you can afford to spend acquiring customers
22. Repeat Purchase Rate
Percentage of customers who make multiple purchases.
- Formula: (Customers with >1 Purchase ÷ Total Customers) × 100
- Example: 430 repeat customers ÷ 1,200 total × 100 = 35.8%
- Why it matters: Indicates customer satisfaction and brand loyalty
23. Customer Retention Rate
Percentage of customers who continue buying over time.
- Formula: ((Customers at End − New Customers) ÷ Customers at Start) × 100
- Example: ((850 − 200) ÷ 800) × 100 = 81.25%
- Why it matters: Retention is cheaper than acquisition; shows business health
24. Churn Rate
Percentage of customers who stop buying within a period.
- Formula: (Customers Lost ÷ Customers at Start) × 100
- Example: 150 lost ÷ 800 at start × 100 = 18.75%
- Why it matters: High churn indicates problems with product, service, or experience
25. Net Promoter Score (NPS)
Customer satisfaction and likelihood to recommend.
- Formula: % Promoters (9-10 rating) − % Detractors (0-6 rating)
- Example: 60% promoters − 15% detractors = NPS of 45
- Why it matters: Predicts growth potential through word-of-mouth and referrals
DashThis: Marketing Reports Made Simple
Automated and easy-to-use marketing reporting tool to save hours of work and create impactful reports.
Key Features
- Automated and customizable dashboards
- Integrations with 80+ platforms
- Pre-built templates for different reports
- White-label reports
- Automated sharing and scheduling
- AI Insights for smart analytics
* This is an affiliate link. If you make a purchase through this link, I may receive a commission at no extra cost to you.
Digital Marketing KPI Examples by Channel
Different channels require specific measurement approaches. Here’s your channel-specific digital marketing KPI dashboard breakdown.
>> SEO KPIs
Search engine optimization requires patient, long-term measurement focused on organic visibility and traffic quality.
Top 5 SEO KPIs:
1. Organic Traffic
- Definition: Visitors who find your site through unpaid search results
- Formula: Sessions with source = « organic » in analytics
- Example: 12,500 organic visitors this month
- Target: 10-20% month-over-month growth for established sites
2. Keyword Rankings
- Definition: Position your pages hold in search results for target keywords
- How to track: SEO tools like Ahrefs, SEMrush, or Google Search Console
- Example: Ranking #3 for « digital marketing dashboard »
- Target: Top 10 positions for priority keywords; top 3 for high-intent terms
3. Organic Conversion Rate
- Definition: Percentage of organic visitors who convert
- Formula: (Organic Conversions ÷ Organic Traffic) × 100
- Example: 180 conversions ÷ 12,500 visitors × 100 = 1.44%
- Target: Typically 2-5% depending on industry and conversion type
4. Domain Authority/Rating
- Definition: Score predicting how well your site will rank (0-100 scale)
- How to track: Moz (DA), Ahrefs (DR), SEMrush (Authority Score)
- Example: Domain Rating of 52
- Target: Gradual improvement over time; compare against competitors
5. Backlinks (Quality)
- Definition: Number and quality of external sites linking to yours
- How to track: Ahrefs, Majestic, SEMrush backlink reports
- Example: 450 referring domains with average DR of 48
- Target: Focus on quality (high DR sites) over quantity
>> PPC & Paid Ads KPIs
Paid advertising demands precise measurement to ensure every dollar delivers maximum return.
Top 5 PPC KPIs:
1. Quality Score (Google Ads)
- Definition: Google’s rating of your ads, keywords, and landing pages (1-10 scale)
- How to track: Google Ads interface, keyword-level metric
- Example: Average Quality Score of 7.2
- Target: 7+ is good; 8+ is excellent; improves ad position and lowers costs
2. Cost Per Acquisition (CPA)
- Definition: Average cost to acquire one customer through paid ads
- Formula: Total Ad Spend ÷ Total Conversions
- Example: $12,000 ÷ 240 conversions = $50 CPA
- Target: Must be significantly lower than customer lifetime value
3. Click-Through Rate (CTR)
- Definition: Percentage of ad viewers who clicked
- Formula: (Clicks ÷ Impressions) × 100
- Example: 850 clicks ÷ 42,500 impressions × 100 = 2%
- Target: 2-5% for search ads; 0.5-1% for display ads
4. Conversion Rate
- Definition: Percentage of ad clicks that result in desired action
- Formula: (Conversions ÷ Clicks) × 100
- Example: 85 conversions ÷ 850 clicks × 100 = 10%
- Target: 2-5% average; varies widely by industry and offer
5. ROAS (Return on Ad Spend)
- Definition: Revenue generated per dollar spent on ads
- Formula: Revenue from Ads ÷ Ad Spend
- Example: $60,000 ÷ $12,000 = 5:1 ROAS
- Target: Minimum 4:1; ideally 8:1+ for sustainable profitability
>> Social Media KPIs
Social media success extends beyond vanity metrics to meaningful engagement and conversions.
Top 5 Social Media KPIs:
1. Engagement Rate
- Definition: Percentage of your audience interacting with content
- Formula: (Likes + Comments + Shares + Saves) ÷ Followers × 100
- Example: (450 + 120 + 85 + 95) ÷ 15,000 × 100 = 5%
- Target: 1-5% is average; 5%+ is excellent
2. Social Referral Traffic
- Definition: Website visitors arriving from social platforms
- How to track: Google Analytics > Acquisition > Social
- Example: 3,200 monthly visitors from social media
- Target: Should contribute 5-15% of total traffic depending on strategy
3. Social Conversion Rate
- Definition: Percentage of social visitors who convert on your site
- Formula: (Social Conversions ÷ Social Traffic) × 100
- Example: 96 conversions ÷ 3,200 visitors × 100 = 3%
- Target: Typically lower than search (0.5-2%); focus on platforms driving quality traffic
4. Share of Voice
- Definition: Your brand mentions vs. competitors in social conversations
- How to track: Social listening tools (Brandwatch, Sprout Social, Mention)
- Example: Your brand = 28% of industry conversation
- Target: Aim to match or exceed market share percentage
5. Cost Per Engagement (CPE)
- Definition: Average cost for each social media interaction
- Formula: Total Social Ad Spend ÷ Total Engagements
- Example: $2,400 ÷ 9,600 engagements = $0.25 CPE
- Target: $0.10-$0.50 depending on platform and objective
>> Email Marketing KPIs
Email remains one of the highest-ROI channels when measured correctly.
Top 5 Email Marketing KPIs:
1. Open Rate
- Definition: Percentage of recipients who opened your email
- Formula: (Emails Opened ÷ Emails Delivered) × 100
- Example: 3,850 opens ÷ 18,000 delivered × 100 = 21.4%
- Target: 15-25% average; varies by industry
2. Click-Through Rate (CTR)
- Definition: Percentage of recipients who clicked any link
- Formula: (Unique Clicks ÷ Emails Delivered) × 100
- Example: 720 clicks ÷ 18,000 delivered × 100 = 4%
- Target: 2-5% is standard; 5%+ is excellent
3. Click-to-Open Rate (CTOR)
- Definition: Percentage of openers who clicked (measures content quality)
- Formula: (Unique Clicks ÷ Unique Opens) × 100
- Example: 720 clicks ÷ 3,850 opens × 100 = 18.7%
- Target: 10-20% indicates compelling content
4. Conversion Rate
- Definition: Percentage of email recipients who completed desired action
- Formula: (Email Conversions ÷ Emails Delivered) × 100
- Example: 144 conversions ÷ 18,000 delivered × 100 = 0.8%
- Target: 1-5% depending on offer and audience quality
5. Revenue Per Email
- Definition: Average revenue generated per email sent
- Formula: Total Email-Generated Revenue ÷ Total Emails Delivered
- Example: $18,000 revenue ÷ 18,000 emails = $1 per email
- Target: Should significantly exceed cost per email sent
>> Content Marketing KPIs
Content marketing requires patience, but these KPIs help prove its business impact.
Top 5 Content Marketing KPIs:
1. Organic Traffic Growth
- Definition: Month-over-month or year-over-year increase in content-driven traffic
- Formula: ((Current Period Traffic − Previous Period) ÷ Previous Period) × 100
- Example: ((15,000 − 12,500) ÷ 12,500) × 100 = 20% growth
- Target: 10-30% monthly growth for new content programs
2. Average Time on Page
- Definition: How long visitors spend reading your content
- How to track: Google Analytics > Behavior > Site Content
- Example: Blog posts average 2 minutes 45 seconds
- Target: 2+ minutes for blog posts; 4+ for pillar content
3. Content Engagement Rate
- Definition: Percentage of visitors who interact beyond basic scrolling
- Formula: (Scroll Depth + Comments + Shares + Time on Page) composite score
- Example: 65% scroll to bottom, 3% comment, 5% share = strong engagement
- Target: 50%+ scroll depth; any comments/shares are positive signals
4. Lead Generation Rate
- Definition: Percentage of content visitors who become leads
- Formula: (Content-Generated Leads ÷ Content Traffic) × 100
- Example: 285 leads ÷ 15,000 visitors × 100 = 1.9%
- Target: 1-3% for gated content; 0.5-1% for blog posts
5. Content ROI
- Definition: Revenue generated compared to content creation costs
- Formula: (Content-Generated Revenue − Content Costs) ÷ Content Costs × 100
- Example: ($45,000 − $8,000) ÷ $8,000 × 100 = 462.5% ROI
- Target: Minimum 200% ROI; world-class content achieves 500%+
DashThis: Marketing Reports Made Simple
Automated and easy-to-use marketing reporting tool to save hours of work and create impactful reports.
Key Features
- Automated and customizable dashboards
- Integrations with 80+ platforms
- Pre-built templates for different reports
- White-label reports
- Automated sharing and scheduling
- AI Insights for smart analytics
* This is an affiliate link. If you make a purchase through this link, I may receive a commission at no extra cost to you.
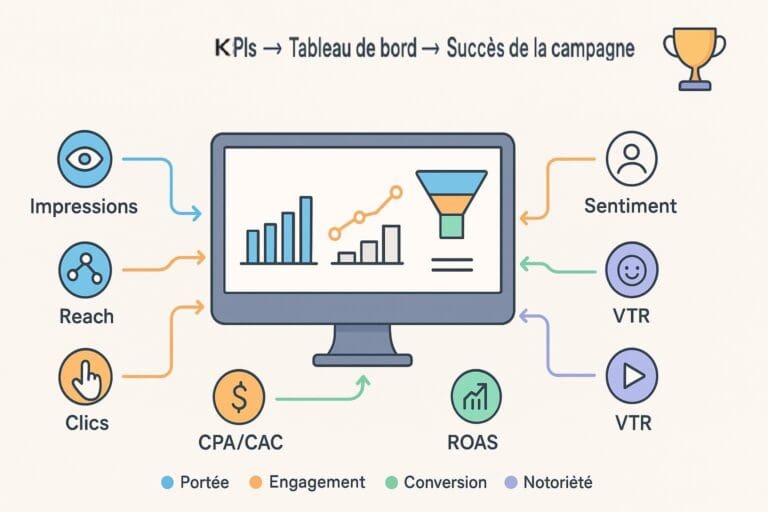
How to Build a Digital Marketing KPI Dashboard
A well-designed digital marketing kpi dashboard transforms raw data into actionable insights at a glance. Here’s how to build one that actually gets used.
What a Good Dashboard Looks Like
Effective dashboards share these characteristics:
Visual hierarchy: Most important KPIs appear at the top and are largest
Clarity over complexity: Focus on 5-10 key metrics, not 50
Real-time or near-real-time data: Automated updates eliminate manual reporting
Comparison context: Show current vs. previous period, vs. target, and trends
Actionable insights: Clear indicators of what needs attention
Role-specific views: Executives see different metrics than channel managers
Choosing the Right Tools
Your dashboard tool should match your technical skills and data sources:
Google Analytics 4 + Looker Studio (Free)
- Best for: Startups and small businesses
- Pros: Free, integrates with Google ecosystem, customizable
- Cons: Requires GA4 setup; limited native integrations beyond Google
HubSpot Marketing Hub ($800+/month)
- Best for: B2B companies using HubSpot CRM
- Pros: All-in-one platform; excellent lead tracking and attribution
- Cons: Expensive; less flexible for custom reporting
Klipfolio/Databox/DashThis ($49-$299/month)
- Best for: Agencies and businesses needing multi-platform integration
- Pros: Connects to 100+ data sources; pre-built templates
- Cons: Can be complex to set up initially
Supermetrics + Google Sheets ($99+/month)
- Best for: Data analysts who want flexibility
- Pros: Unlimited customization; cost-effective
- Cons: Requires spreadsheet skills; manual dashboard updates
Tableau/Power BI (Enterprise)
- Best for: Large organizations with dedicated analytics teams
- Pros: Powerful data visualization; handles massive datasets
- Cons: Steep learning curve; expensive
Step-by-Step Dashboard Build
Step 1: Define Your Audience
Who will use this dashboard? Executives need high-level metrics; marketers need granular channel data. Create different views for different stakeholders.
Step 2: Select Your Core KPIs
Choose 5-10 metrics that directly answer your key business questions:
- Are we reaching our revenue targets?
- Which channels are most cost-effective?
- Are we improving customer acquisition efficiency?
- Is customer retention improving?
Step 3: Establish Data Connections
Connect your data sources to your dashboard tool:
- Website analytics (GA4, Adobe Analytics)
- Advertising platforms (Google Ads, Facebook Ads, LinkedIn)
- Social media (native APIs or tools like Supermetrics)
- Email marketing (Mailchimp, HubSpot, Klaviyo)
- CRM (HubSpot, Salesforce)
Step 4: Design Your Layout
Follow this proven structure:
Top Section — Executive Summary
- Revenue
- ROAS or ROI
- Total conversions
- CAC
Middle Section — Channel Performance
- Traffic by channel
- Conversions by channel
- Cost efficiency metrics
Bottom Section — Detailed Metrics
- Channel-specific KPIs
- Trend comparisons
- Goals vs. actuals
Step 5: Add Context
Numbers without context are meaningless. Include:
- Previous period comparisons (MoM, YoY)
- Target benchmarks
- Trend lines showing direction
- Traffic light indicators (red/yellow/green for at-risk metrics)
Step 6: Test and Iterate
Share the dashboard with users and ask:
- Can you make a decision based on this data?
- What questions does this answer?
- What’s missing?
Refine based on feedback.
Recommended Visualizations
Match visualization type to data type:
Line charts: Best for trends over time (traffic growth, conversion rate trends)
Bar charts: Best for comparing categories (channel performance, campaign comparison)
Pie charts: Best for showing composition (traffic source breakdown, but use sparingly)
Scorecards: Best for single key numbers (total revenue, ROAS, monthly leads)
Tables: Best for detailed breakdowns requiring specific numbers
Gauges: Best for showing progress toward a goal (monthly target achievement)
Dashboard Template
Ready to start tracking? Access our free templates:
- Google Looker Studio Template: Pre-built GA4 dashboard with essential marketing KPIs
- Excel/Google Sheets KPI Tracker: Manual input template with formulas and charts
- Channel-Specific Dashboards: SEO, PPC, Social Media, and Email templates
[These would typically be downloadable resources or links in a live article]
DashThis: Marketing Reports Made Simple
Automated and easy-to-use marketing reporting tool to save hours of work and create impactful reports.
Key Features
- Automated and customizable dashboards
- Integrations with 80+ platforms
- Pre-built templates for different reports
- White-label reports
- Automated sharing and scheduling
- AI Insights for smart analytics
* This is an affiliate link. If you make a purchase through this link, I may receive a commission at no extra cost to you.
KPI Benchmarks: What « Good » Looks Like
Understanding whether your metrics are performing well requires context. Here are general benchmarks across industries, but remember: your specific business model, audience, and market will impact what’s achievable.
Website & Traffic Benchmarks
- Average session duration: 2-3 minutes (information sites); 5-10+ minutes (e-commerce)
- Bounce rate: 40-60% is average; <40% is excellent; >70% needs attention
- Pages per session: 2-4 pages average; 5+ indicates strong engagement
SEO Benchmarks
- Organic CTR (by position):
- Position 1: 30-35%
- Position 2-3: 15-20%
- Position 4-10: 5-10%
- Organic conversion rate: 2-5% average; 10%+ for high-intent keywords
Paid Advertising Benchmarks
- Google Ads CTR: 2-5% search; 0.5-1% display
- Facebook Ads CTR: 0.9% average across industries
- LinkedIn Ads CTR: 0.4-0.5% average
- Average ROAS: 4:1 minimum for profitability; 8:1+ for strong performance
Social Media Benchmarks
- Instagram engagement rate: 1-3% average; 3-6% excellent
- Facebook engagement rate: 0.5-1% average
- LinkedIn engagement rate: 2-3% for company pages
- Twitter engagement rate: 0.5-1% average
Email Marketing Benchmarks
- Open rate: 15-25% average; varies significantly by industry
- Click-through rate: 2-5% standard; 7%+ excellent
- Unsubscribe rate: <0.5% healthy; >2% problematic
- Email conversion rate: 1-5% depending on offer
E-commerce Benchmarks
- Conversion rate: 2-3% average; 5%+ excellent
- Cart abandonment rate: 60-80% (recovery campaigns essential)
- Average order value: Industry-specific; track your baseline and improve incrementally
B2B Lead Generation Benchmarks
- Landing page conversion rate: 5-15% for top-of-funnel; 20%+ for bottom-funnel
- MQL to SQL ratio: 20-30% (varies by qualification rigor)
- Lead-to-customer conversion: 5-20% depending on sales cycle and deal size
How to Interpret Performance
Above benchmark: You’re doing well, but continue optimizing. Look for patterns in what’s working.
At benchmark: You’re competitive. Focus on finding inefficiencies and testing improvements.
Below benchmark: Don’t panic. Identify your specific issues:
- Is it your audience targeting?
- Is it your offer or messaging?
- Is it technical issues?
- Is it competitive pressure?
Avoiding False Comparisons
Benchmarks are guidelines, not absolutes. Your performance depends on:
Industry: B2B SaaS metrics differ dramatically from D2C e-commerce
Business maturity: Startups often have lower efficiency but higher growth rates
Market conditions: Competitive industries have higher CPCs and lower conversion rates
Product pricing: High-ticket items naturally have lower conversion rates but higher value
Target audience: B2B enterprise sales have completely different metrics than consumer impulse purchases
Always compare against your own historical performance first, then use industry benchmarks as a reality check.
DashThis: Marketing Reports Made Simple
Automated and easy-to-use marketing reporting tool to save hours of work and create impactful reports.
Key Features
- Automated and customizable dashboards
- Integrations with 80+ platforms
- Pre-built templates for different reports
- White-label reports
- Automated sharing and scheduling
- AI Insights for smart analytics
* This is an affiliate link. If you make a purchase through this link, I may receive a commission at no extra cost to you.
Common KPI Mistakes to Avoid
Even experienced marketers fall into these traps. Avoid them to ensure your KPIs actually drive better decisions.
Mistake #1: Tracking Too Many KPIs
The problem: When everything is a priority, nothing is. Dashboards with 50+ metrics overwhelm teams and obscure what actually matters.
The solution: Limit yourself to 5-7 primary KPIs per channel or campaign. Additional metrics can be secondary, but your core KPIs should be the ones you review daily or weekly.
Example:
Instead of tracking 20 social media metrics, focus on engagement rate, social referral traffic, and cost per engagement for paid campaigns.
Mistake #2: No Connection to Business Goals
The problem: Tracking metrics that make you feel busy but don’t impact revenue, growth, or profitability.
The solution: Every KPI should answer: « How does improving this metric help us achieve our business objectives? »
Example: If your goal is to increase revenue by 30%, don’t obsess over brand awareness metrics like impressions. Focus on conversion rate, ROAS, and customer acquisition cost.
Mistake #3: Not Segmenting Data
The problem: Aggregate data hides important insights. Average performance across all channels or audiences can mask both exceptional opportunities and serious problems.
The solution: Segment your KPIs by:
- Channel (organic vs. paid vs. social)
- Device (mobile vs. desktop)
- Audience (new vs. returning; demographic segments)
- Campaign type (brand vs. non-brand; remarketing vs. prospecting)
- Product category
Example: Your overall conversion rate might be 3%, but mobile could be 1.5% while desktop is 4.5%—revealing a mobile experience problem.
Mistake #4: Not Updating KPIs Over Time
The problem: Your business evolves, but your KPIs don’t. What mattered in startup mode (growth at all costs) is different from scale mode (profitable growth).
The solution: Review and update your KPIs quarterly:
- Have our business goals changed?
- Are we measuring what actually matters now?
- Do we need new KPIs for new channels or initiatives?
Example: An early-stage company might focus purely on user acquisition. A mature company needs to shift focus to customer lifetime value and retention metrics.
Mistake #5: Ignoring Statistical Significance
The problem: Making decisions based on small sample sizes or short timeframes leads to false conclusions.
The solution: Ensure you have adequate data before making decisions:
- Run tests long enough to account for weekly/monthly cycles
- Use statistical significance calculators for A/B tests
- Look for consistent trends, not one-day anomalies
Example: Don’t change your entire strategy because one email had a 40% open rate—it might be an outlier. Look at trends across multiple sends.
Mistake #6: Vanity Metrics Masquerading as KPIs
The problem: Reporting metrics that look impressive but don’t indicate business health.
The solution: For every metric, ask: « Can I make a business decision based on this number? »
Bad KPI examples:
- Total social media followers (without engagement or conversion context)
- Page views (without time on page or conversion data)
- Email list size (without engagement or revenue metrics)
Better alternatives:
- Engaged follower growth + social referral conversions
- Engaged sessions (time on page >1 minute + pages/session >2)
- Email list growth + revenue per subscriber
Mistake #7: Not Considering Attribution
The problem: Last-click attribution gives all credit to the final touchpoint, ignoring the customer journey.
The solution: Use multi-touch attribution models when possible, or at least acknowledge that your « conversion source » data oversimplifies reality.
Example: A customer might discover you through organic search, engage via social media, read emails, and then convert via a paid ad. Giving all credit to that final paid ad undervalues your other channels.
Mistake #8: Benchmarking Without Context
The problem: Comparing your metrics to industry averages without considering your unique situation.
The solution: Build your own benchmarks first. Track your performance over 3-6 months to establish your baseline, then compare against industry standards with appropriate context.
Example: If you’re a luxury brand with high-ticket products, your conversion rate will naturally be lower than a mass-market competitor, but your revenue per visitor should be much higher.
DashThis: Marketing Reports Made Simple
Automated and easy-to-use marketing reporting tool to save hours of work and create impactful reports.
Key Features
- Automated and customizable dashboards
- Integrations with 80+ platforms
- Pre-built templates for different reports
- White-label reports
- Automated sharing and scheduling
- AI Insights for smart analytics
* This is an affiliate link. If you make a purchase through this link, I may receive a commission at no extra cost to you.
Free Templates & Resources
Get started immediately with these ready-to-use tools for tracking your digital marketing KPIs and metrics.
KPI Tracking Templates
Google Sheets KPI Dashboard
- Pre-built formulas for all 25 core KPIs
- Monthly tracking across all major channels
- Automated charts and visualizations
- Easy to customize for your business
Excel Marketing KPI Tracker
- Quarterly and annual reporting views
- Budget vs. actual performance tracking
- ROI calculators built-in
- Suitable for agencies managing multiple clients
Channel-Specific Templates:
- SEO KPI Tracker (rankings, traffic, conversions)
- PPC Campaign Performance Sheet (ROAS, CPA, Quality Score)
- Social Media Metrics Dashboard (cross-platform comparison)
- Email Marketing Analytics Tracker (deliverability through conversion)
Dashboard Templates
Google Looker Studio Templates:
- Complete marketing overview dashboard (connects to GA4)
- E-commerce performance dashboard
- Lead generation tracking dashboard
- Social media performance dashboard
All templates include:
- Pre-built data connections
- Custom date range filters
- Comparison metrics (MoM, YoY)
- Visual indicators for performance
Reference Guides
Digital Marketing KPI Cheat Sheet (PDF)
- All 25 KPIs with formulas on one page
- Channel-specific quick reference guide
- Benchmark ranges by industry
- Perfect for printing and desk reference
KPI Selection Framework (PDF)
- Step-by-step worksheet for choosing the right KPIs
- SMART goal setting template
- Funnel-mapping exercise
- Business goal alignment checklist
How to Access These Resources
[In a live article, this would include actual links or a lead capture form]
These templates are designed to save you hours of setup time and give you a professional foundation for tracking what matters most to your business.
DashThis: Marketing Reports Made Simple
Automated and easy-to-use marketing reporting tool to save hours of work and create impactful reports.
Key Features
- Automated and customizable dashboards
- Integrations with 80+ platforms
- Pre-built templates for different reports
- White-label reports
- Automated sharing and scheduling
- AI Insights for smart analytics
* This is an affiliate link. If you make a purchase through this link, I may receive a commission at no extra cost to you.
From Data to Decisions
Digital marketing KPIs and metrics aren’t just numbers in a spreadsheet—they’re the language of growth. The difference between marketing that feels productive and marketing that actually drives business results comes down to measuring what matters.
Here’s what we’ve covered:
The 25 most important digital marketing KPIs organized by funnel stage, complete with formulas and benchmarks. How to choose the right KPIs based on your business model, goals, and growth stage. Channel-specific metrics for SEO, PPC, social media, email, and content marketing. Practical guidance for building dashboards that turn data into action. Common mistakes that lead to wasted effort and misguided decisions.
Your next steps:
- Audit your current tracking: Are you measuring what actually matters, or just what’s easy to measure?
- Download the templates: Get our free KPI tracking sheets and dashboard templates to start immediately.
- Set up your baseline: Track your current performance for 30 days to establish benchmarks.
- Focus on 5-7 core KPIs: Choose the metrics most directly tied to your business goals.
- Review and optimize weekly: Let your data guide your strategy, not your assumptions.
Remember, the goal isn’t to track everything—it’s to track the right things and act on what you learn. The most successful digital marketers don’t have more data; they have better clarity about what their data means and what to do about it.
Ready to transform your marketing performance? Start with clear KPIs, build a simple dashboard, and let your data light the path to better results.
Related Resources:
- How to Build a Marketing Analytics Strategy from Scratch
- Google Analytics 4: Complete Setup Guide for Marketers
- Marketing Attribution Models Explained (with Examples)
- ROI Calculator: Is Your Marketing Actually Profitable?